
Report cover
Source: 2026 AI Index Report
On April 13, the Stanford Institute for Human-Centered Artificial Intelligence(HAI) released the 2026 AI Index Report, which documents global artificial intelligence developments throughout 2025. Comprising nine chapters and spanning 423 pages, the report tracks key issues including research and development, technical performance, responsible AI, economy, science, medicine,education, policy and governance, and public opinion. Adopting a data-driven approach, it stands as one of the most comprehensive research publications in the AI sector and has been cited for years by media outlets and think tanks across the United States, the European Union, the United Kingdom, and beyond.
There port is led by a research team at Stanford University, supported by a Steering Committee composed of experts from leading institutions including Google, OpenAI, Anthropic, and the OECD, and developed in collaboration with specialized organizations such as Schmidt Sciences.

Research team members of the 2026 AI Index Report
Source: 2026AI Index Report
01 ReportOverview & Key Trends
1. Structural Changes of the Report
Since 2017, the Stanford Institute for Human-Centered Artificial Intelligence (HAI) has continuously tracked developments in theglobal AI industry, with the 2026 edition marking its ninth annual installment.Compared with the 2024 and 2025 versions, the 2026 AI Index Reportfeatures several key structural enhancements, centered on three major shifts.
First, the report separates Science and Medicine into stand alone chapters. Breaking from the 2024 and 2025 practice of combining “Science and Medicine” into a single section, the 2026 edition splits them into two independent chapters for the first time. This change underscores the deepening penetration of AI applications in both fields and reflects that domain-specific AI research has reached ascale that merits dedicated, standalone analysis.

Comparison of chapterstructures of the reports from 2024 to 2026
Source: AI Index Reports 2024–2026
Second, the report introduces issues related to AI infrastructure. It adds a dedicated analytical framework for AI Sovereignty, expanding the discussion from a purely technological ecosystem perspective to the geopolitical dimension. The framework covers core elements including infrastructure sovereignty, data sovereignty, model sovereignty, application sovereignty, and talent sovereignty—echoing recent concerns among governments worldwide over technological autonomy and data security in AI policymaking.
Source: 2026 AI Index Report
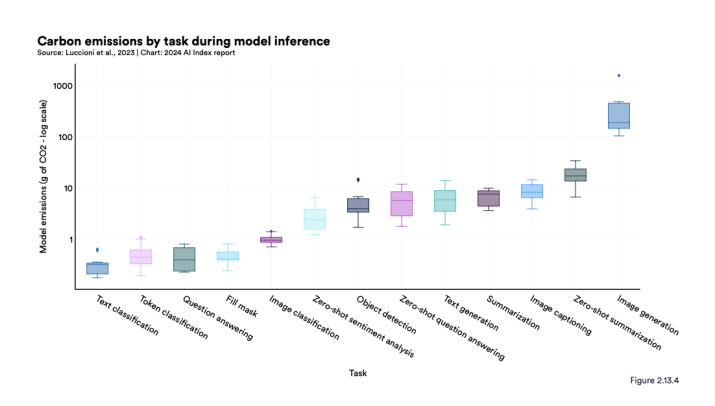
Third, the report strengthens its focus on environmentalprotection. In the 2024 edition, environmental issues were discussed at the end of Chapter 2, Technical Performance, with an emphasis on measuring the environmental footprint of AI systems.
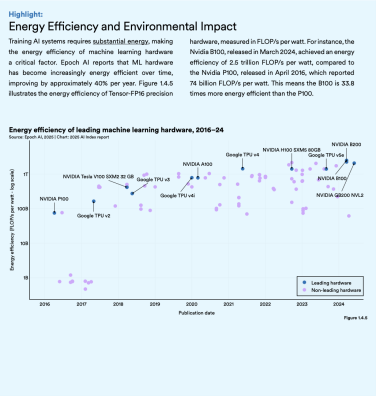
By contrast, the 2026 report dedicates specialized data tracking to the geographic distribution, energy consumption, andwater use of data centerswithin itsfirst chapter. This moveformally integrates AI development into the broader framework of resource sustainability, highlighting the need to balance technological advancement and environmental capacity.
Source: 2024 AI Index Report (left); 2025 AI Index Report(right)
2. The Evolution of the AI Industry
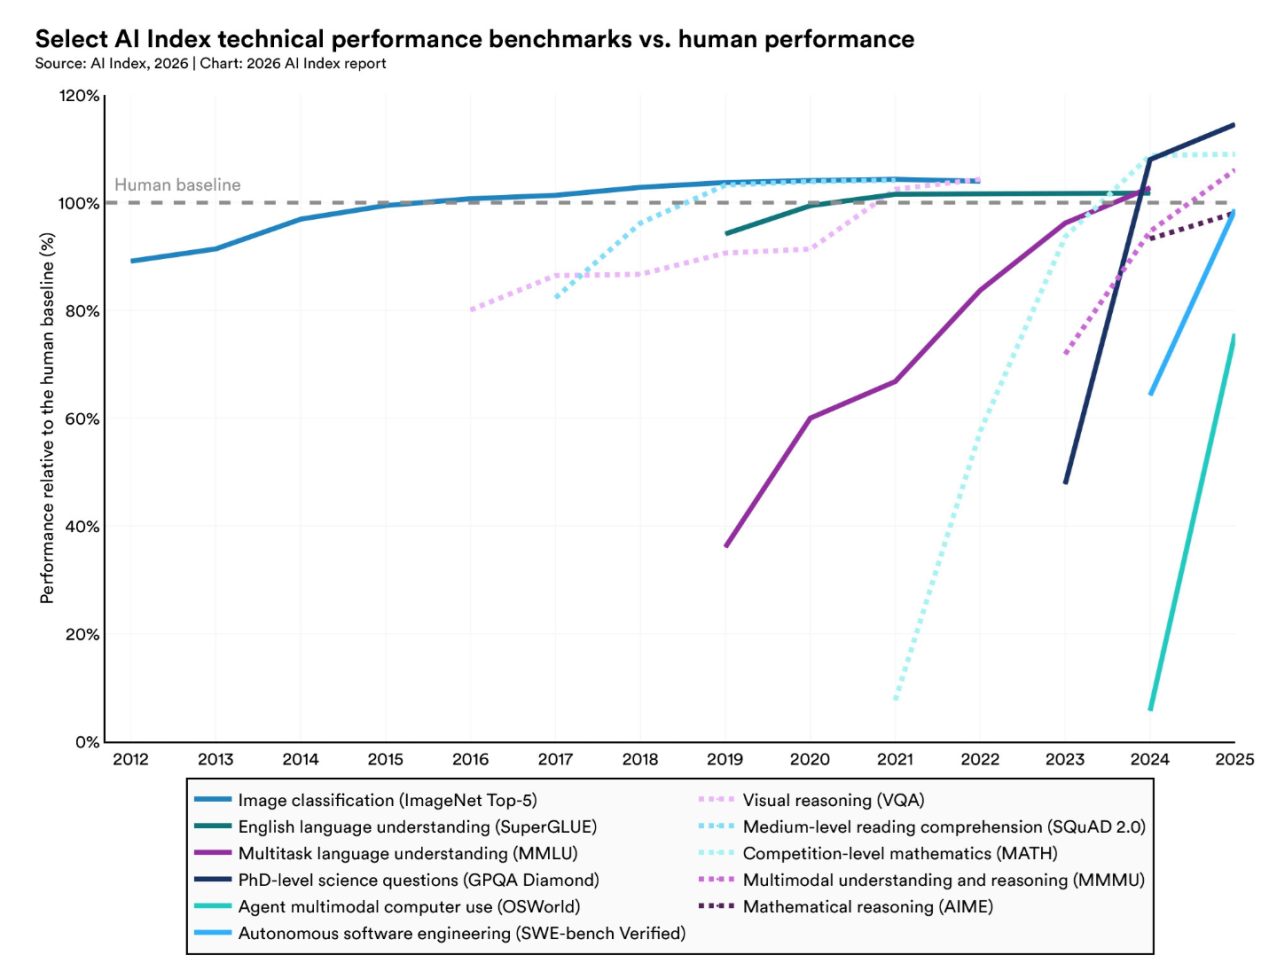
First, AI technological capabilities iterate rapidly. In 2023, AI outperformed humans on basic tasks such asimage classification and visual reasoning. In 2024, scores on multimodal andscientific reasoning benchmarks (including MMMU and GPQA) rose by 18% to 48% ina single year. By 2026, top models could solve PhD-level scientific problemsand achieve gold-medal performance at the International Mathematical Olympiad. On the key coding benchmark SWE-bench Verified, performance surged from roughly 60% in 2025 to nearly 100%. However, capability improvements are uneven. Thereport summarizes this as the “JaggedFrontier,” warning that policy evaluation should notreplace comprehensive judgment of real-world AI deployment capacity with single benchmark results.
Second, the performance gap between leading AI powers has narrowed sharply. In 2023, the United States released 61 top-tier models while China released 15, representing a wide gap. In 2024, the ratioshifted to 40 versus 15. By 2026, the performance gap between top models fromthe two countries had shrunk to about 2.7%, and the lead has changed handsmultiple times since early 2025. In February 2025, China’s DeepSeek-R1 brieflymatched the performance of the leading U.S. model at that time. Meanwhile, theUnited States has seen a notable decline in its ability to attract global AItalent, with net talent inflows dropping by about 89% from the 2017 peak.
Third, widespread AI adoption and falling costs proceed in tandem. Generative AI reached a global adoption rate ofapproximately 53% in just three years, far outpacing the historical uptake ofthe internet and personal computers. On the investment side, generative AI funding reached $25.2 billion in 2023, eight times the 2022 total, and rose further to $33.9 billion in 2025. Driven by breakthroughs in small-modeltechnologies, AI inference costs fell roughly 280-fold between 2022 and 2024,significantly lowering barriers to adoption. In 2024, 78% of surveyed organizations used AI in at least one business process. By 2026, the annual value created by AI tools for U.S. consumers was estimated at about $172 billion.
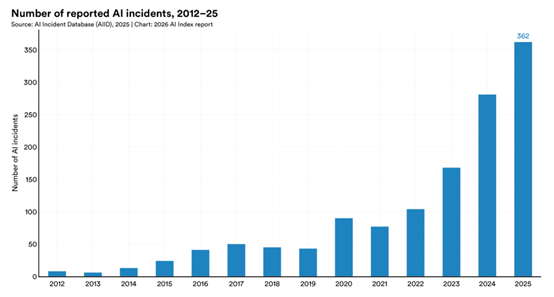
Fourth, the structural gap between expanding AI capabilities and insufficient societal readiness has widened. Legislatively, the number of AI-related regulations in the United States rosefrom 1 in 2016 to 25 in 2023, and doubled again across federal agencies in2024, showing accelerated regulatory institutionalization. However, increased regulatory density has not translated into effective risk governance. Documented AI safety incidents rose from 233 in 2024 to 362 in 2026, with asevere lack of standardized industry safety assessment mechanisms. At the sametime, major developers have continued to reduce disclosure of training data andparameter sizes. The average score on the Foundation Model Transparency Indexfell from 58 to 40.
This in-depth analysis draws on the 2026 AI Index Report as its core reference. Against the context outlined above, it willoffer targeted commentary on key findings chapter by chapter.
02 Summary of Core Findings
1. AI Capabilities Continue to Advance Rapidly WhileModel Transparency Keeps Declining
In 2025, industry produced more than 90% of notable frontier AI models. Several of these models met or exceeded human baselines on PhD-level science questions, multimodal reasoning, and competition mathematics. On the SWE-bench Verified coding benchmark,performance jumped from 60% to nearly 100% in one year. Organizational adoption reached 88%, and four in five university students now use generative AI.
Meanwhile, the most capable models are also the least transparent. Organizations including OpenAI, Anthropic, and Google no longer publicly disclose training code, parameter counts, or dataset sizes. Of the 95 notable models released in 2025, 80 were released without training code, andonly 4 were made fully open-source. The report notes that this growing opacity limits external researchers’ ability to reproduce results, audit development processes, and validate safety claims.
Source: 2026 AI Index Report
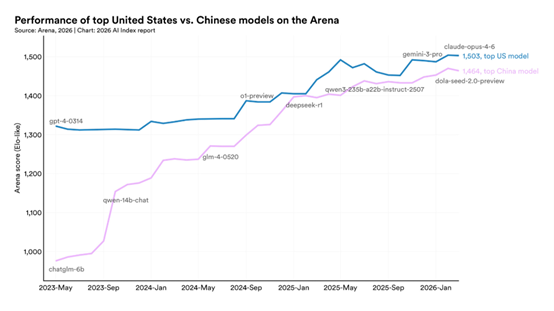
2. The Performance Gap Between Chineseand U.S. AI Models Has Narrowed Significantly While Both Countries Hold Distinct Advantages Across the Global AI Industry Chain
Chinese and U.S. AI models have repeatedly traded leadssince early 2025. As of March 2026, Anthropic’s Claude Opus 4.6 model outperformed China’s Dola-Seed-2.0 Preview model by just 2.7% on the Arenabenchmark.
Across broader competitive dimensions, the U.S. produced 50 notable AI models in 2025 (versus 30 from China), retaining an edge in the volume of top-tier models and high-impact patents. China’s share of the world’s top 100 most-cited AI papers rose from 33 in 2021 to 41 in 2024, leading globally in publication volume, citation counts, patent output, and industrialrobot installations. The Republic of Korea ranked first worldwide in AI patentsper capita, setting a benchmark for innovation density.
Meanwhile, the United States has seen a sharp decline inits ability to attract global AI talent. The number of AI researchers relocatingto the U.S. has dropped 89% since 2017—including an 80% plunge in the past yearalone. The report notes that the U.S. still hosts the largest population of AItalent, but its rate of new talent attraction has fallen to its lowest level in more than a decade.
Source: 2026 AI Index Report
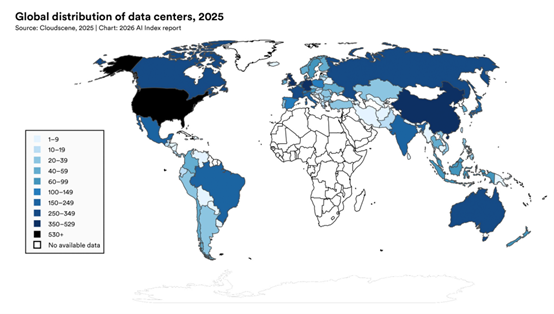
3. U.S. Hosts World’s Largest Number of Data Centers, While Global AI Hardware Supply Chain Relies Heavily on a Single Node
In terms of computing power, global AI compute capacity has grown at an annual rate of approximately 3.3-fold, reaching about 17.1 million H100-equivalent units by 2025. Among this total, computing power provided by NVIDIA devices accounts for more than 60%.
The United States is home to 5,427 data centers—more than 10 times the number in any other country, including Germany, the United Kingdom, and China.
The report also clearly states that TSMC representsa single point of dependency in the global AI supply chain. It fabricates nearly all leading AI chips, including NVIDIA’s Blackwell GPUs and AMD’s MI300X, making the global AI hardware supply chain highly dependent on a single foundry.
Source: 2026 AI Index Report
4. The “Jagged Frontier” Phenomenon Highlights Deep Structural Imbalances in AI Capabilities
AI capability development exhibits extreme asymmetry,forming the distinct pattern known as the Jagged Frontier.
While Gemini Deep Think earned a gold medal with 35 pointsat the International Mathematical Olympiad (IMO) by solving problems end-to-endin natural language within 4.5 hours, top-tier models scored only 50.1%accuracy on the ClockBench benchmark for reading analog clocks—far below the 90.1% human level.
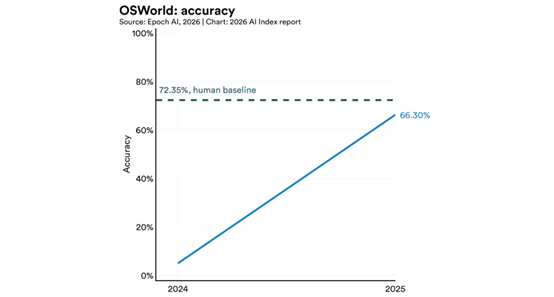
AI agents saw a surge in performance on the OSWorld benchmark, jumping from 12% to 66.3% task success, bringing them within 6 percentage points of human performance, yet still failing roughly one-third ofall task attempts.
The gap is even starker in robotics: models achieved an 89.4% success rate on tasks in software simulation environments, but recordedonly a 12% success rate when performing real-world household chores.
Source: 2026 AI Index Report
5. ResponsibleAI Systems Lag Far Behind the Pace of AI Technological Advancement
While nearly all frontier model developers fully discloseperformance results on benchmarks such as MMLU and SWE-bench, disclosure onresponsible AI benchmarks remains sporadic and incomplete.
In 2025, the AI Incident Database recorded 362 documentedAI-related negative incidents, an increase of more than 55% from 233 in 2024.
After rising from 37 to 58 between 2023 and 2024, theaverage score on the Foundation Model Transparency Indexdropped sharply to 40 in 2025. Major gaps persist in disclosure of trainingdata, investment in compute resources, and post-deployment societal impacts.
Furthermore, inherent trade-offs existacross core dimensions of responsible AI—including safety, fairness, and privacy—and current frameworks cannot effectively reconcile these conflicts.Empirical studies show that training techniques optimized for onedimension consistently degrade performance in others. For instance,strengthening privacy protections reduces fairness, and tightening safetysafeguards lowers model accuracy.
Source:2026AI Index Report
6. GlobalAI Investment and Adoption Expand at Historic Pace While Showing High Concentration
In 2025, global corporate AI investment doubled.Private-sector AI investment rose 127.5% year on year, with generative AI-related investment surging by more than 200%. U.S. private AI investment reached $285.9 billion, more than 23 times that of China. Generative AI reached 53% global adoption in just three years, far outpacing the personal computerand the Internet. The annual consumer surplus it generated in the United Stateswas estimated at $172 billion.
However, AI investment and adoption remain highly concentrated: the number of billion-dollar financing deals in AI nearly doubled worldwide, with top players capturing the vast majority of resources.Meanwhile, generative AI adoption in the United States stood at only 28.3%,ranking 24th globally, well below Singapore (61%) and the United Arab Emirates(54%).
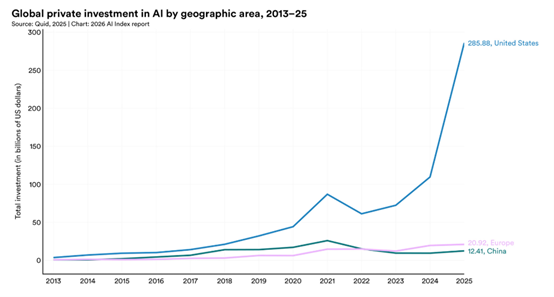
Global privateinvestment in AI by geographic area, 2013–2025
Source: 2026 AI Index Report
7. Formal Education Lags Behind AI Diffusion, Witha Clear Gap Between Student AI Use and School Policy
Over 80% of U.S. high school and college students use AI for schoolwork, yet only half of U.S. middle and high schools have adopted AI-related policies, and just 6% of teachers report clear and usable AIpolicies at their schools.
Enrollment in computer science programs at four-year U.S.universities fell 11%, while the number of master’s graduates in AI-related fields rose 17% year on year. Between 2022 and 2024, the number of new AI PhD graduates in the United States and Canada increased by 22%, and all of these new graduates entered academia—completely reversing the decade-long trend ofnew AI PhDs primarily joining industry.
China and the United Arab Emirates have mandated nationwide AI education starting in the 2025–2026 academic year. Globally, however, accessto AI education still lags significantly behind computer science education.
03 In-depthinterpretation of the report
In-depth Analysis 1: The Measurement Crisis and the Shaken Foundationsof AI Governance
Throughout the 2026 AI Index Report, one criticaltrend—not listed in the Top Takeaways but profoundly consequential—standsout: we are losing the technical ability to conduct external oversight overcutting-edge AI systems.
This conclusion appears across empirical data in Chapter 3on model transparency, benchmark reporting rates, and reliability. Taken together, global AI governance faces a severe “measurement crisis.”
First, model transparency has regressedsignificantly. In 2025, the average score on the Foundation Model Transparency Index (FMTI)plummeted to 40, down sharply from 58 the previous year. While IBM maintained aleading score of 95, models including xAI’s Grok 3 and Midjourney V7 scoredonly 14 (see Figure 3.8.2).
A deeper problem is that more than 90% of notable industry models in 2025 were released without publicly available training code. Leading firms including OpenAI, Anthropic, and Google have fully stopped disclosing critical details for their core systems: parameter counts, datasetsizes, and training duration.
This means external researchers and regulators canno longer obtain basic factual information about the most advanced large models.
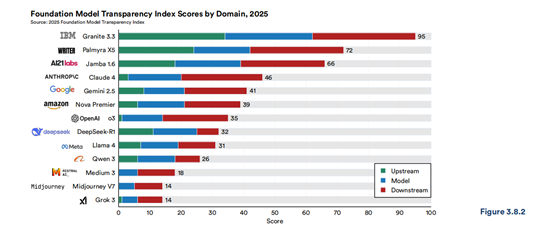
Distribution ofFoundation Model Transparency Index (FMTI) scores for 2025
Source: 2026AI Index Report
Second, capability assessments have become saturated, while responsibility assessments are nearly blank. The report compares for the first time thetesting disclosures of cutting-edge models on capability benchmarks (such asMMLU, GPQA) and responsible AI benchmarks (such as BBQ, HarmBench). The results show that nearly all models published their capability scores, but left largegaps in responsibility benchmarks. For example, only Claude Opus 4.5 published more than two responsibility benchmark scores, and only GPT-5.2 published Strong REJECT test results.
Meanwhile, traditional capability benchmarks themselves arelosing discriminatory power. Scores of mainstream models on SWE-bench Verifiedsurged from around 60% to nearly 100% within a year, and scores on HELM Safetyare also highly concentrated within a narrow range of 0.90–0.98 (see Figures3.2.3 and 3.2.4). As noted in the report, existing test benchmarks can nolonger effectively measure real performance differences among cutting-edge models.
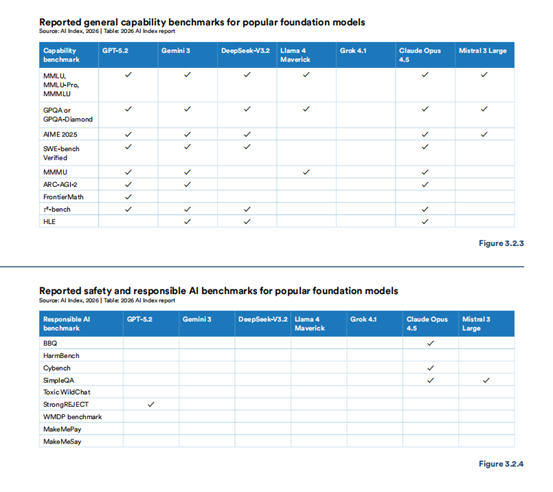
Comparison of reported capability benchmarks and responsible AIbenchmarks for major frontier models
Source: 2026AI Index Report
Third, significant discrepancies exist betweenmodels’ actual performance and their test scores. Two new benchmarks introduced in Chapter 3 further confirmthis point.
In the AA‑Omniscience test, thehallucination rates of 26 cutting‑edge models vary widely, ranging from 22% to 94%.
The KaBLE benchmark shows that GPT‑4oachieves an accuracy rate of 98.2% when handling factual statements, yet its accuracy plummets to 64.4% when facingmisleading first‑person questions. Similarly, DeepSeek R1 drops from over 90% to 14.4% in the same test (see Figure3.2.8).
This indicates that a model’s factual judgment is highlyvulnerable to prompt wording. High scores in external rankings cannot reliably reflect a model’s reliability in real business scenarios.
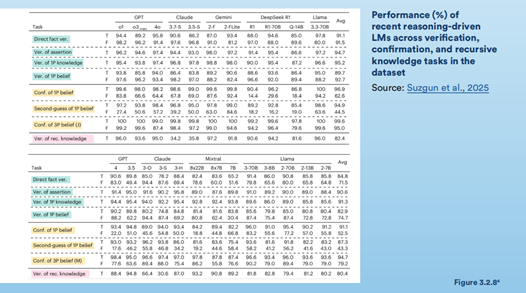
Performance of cutting-edge models on verification, confirmation,and recursive knowledge tasks in the KaBLE benchmark
Source: 2026 AI Index Report
Fourth, real conflicts exist among the variousgovernance objectives of responsible AI. Empirical studies cited in Section 3.10 of Chapter 3 findthat technical optimization targeting one dimension of responsibility, such asprivacy, often leads to degraded performance in another dimension, such asfairness or accuracy. The industry currently lacks mature mechanisms toreconcile these inherent conflicts. This means that “responsible AI” is not atechnical indicator that can be maximized across the board, but a governancechoice that requires decision-makers to make practical trade-offs. Until theunderlying technical logic is clarified, any governance framework built solelyon checklists will suffer from applicability flaws.
Impact on and Implications forGlobal AI Governance
Evidence from the four dimensions above points to a central crisis: prevailing mainstream AI governance frameworks, including the EU AI Act, the U.S. NIST AI RMF, and ISO/IEC 42001, are all built on the premise that AI systems’ capabilities and risks are measurable, disclosable, and comparable—and this premise is collapsing.
First, existing regulatory levers are becomingless effective. The approach of“regulation based on benchmark performance” has hit a ceiling. With decliningcorporate disclosure, saturated testing metrics, and ineffective independentre-evaluation, tiered regulation based on model capabilities will become increasingly difficult to implement in practice.
Second, the evaluation system is in urgent needof restructuring. Existing governance models must transform. Regulators need to shift from traditional“static document review” to “requiring dynamic access rights,” exploring continuous red-teaming, cross-agency joint audits, and long-term tracking of model behavior.
Third, it identifies a realistic entry point forinternational cooperation. Restructuring the measurement system happens to be one of the few areas where substantialconsensus can be reached among China, the United States, and Europe. Unlikehighly sensitive issues such as cross-border data flows or cutting-edge technological competition, “how to objectively and reliably assess frontierlarge models” is a shared technical pain point across jurisdictions. In theglobal AI governance process in the coming years, focusing on such practical technical propositions will be more strategically feasible than protracted debates over grand concepts.
In-depth Analysis 2: Heterogeneous Competition and the Parallel Evolution of Two “AI-Industry” Paths
The 2026 edition of the report reveals a keyfact regarding China-U.S. issues: the performance gap between top-tier foundation models has essentially closed. As of March 2026, the difference in Arena scores betweenthe strongest U.S. model, Claude Opus 4.6, and China’s leading model,Dola-Seed-2.0 Preview, stood at only 2.7%, with the two sides repeatedlytrading leads on leaderboards over the past year. However, a narrowing gap does not mean homogenization. A closer look at the full dataset shows that while China and the United States have reached comparable levels in frontier capabilities, they are pursuing distinct industrial pathways.
First, the channels through which capital flowsinto AI are asymmetric. In2025, U.S. private AI investment reached $285.9 billion, approximately 23 timesthat of China, and the number of new AI companies also held an overwhelming advantage. But these figures only reflect market performance. The report reveals another critical dimension in a footnote: between 2000 and 2023, China deployed a total of approximately $912 billion through government-guided funds, of which an estimated $184 billion was directly channeled into AI. This difference in statistical scope reflects a fundamental divergence in capital pathways:the United States relies on venture capital and capital expenditure from hyperscale cloud providers, concentrating resources intensely in a small numberof frontier labs; China uses industrial policies and guided funds to allocate resources broadly across more inclusive application layers and the real industrial ecosystem.
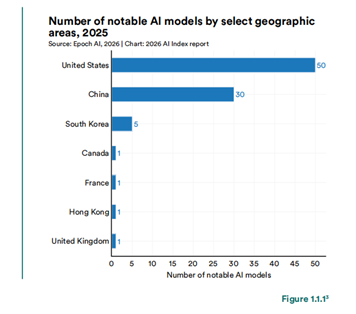
Number of notable AImodels released by select geographic areas in 2025
Source: 2026 AI Index Report
Second, research output and talent structure show a mirror-image distribution.In terms of the number of top 100 highly-cited AI papers,China and the U.S. have moved in opposite directions: between 2021 and 2024, the U.S. dropped from 64 to 46, while China rose from 33 to 41. The U.S. stillleads in notable model releases, however, by 50 to 30. This suggests that U.S.research influence is highly concentrated in top institutions, while China’soutput base is broader.
Meanwhile, the report documents an underappreciated talenttrend: the number of AI researchers moving to the U.S. has plummeted 89% since2017, including an 80% drop in the past year alone. As America’stalent-attraction effect weakens significantly, reliance on highly concentrated talent for cutting-edge model development will become a long-term factor.
Third, advantages have diverged along the“digital vs. physical” dimension.China’s share of new global industrial robot installations has risen to 54.4%, far exceeding that of the U.S., Germany, Japan, and othercountries. Combined with the comparison of notable model counts, a patterne merges: the U.S. dominates AI in the digital and virtual domain, while China is gradually building barriers in the scale of physical and embodied AI deployment. These represent two distinct capability systems. The former depends heavily on extreme concentration of computing power, data, and top-tier talent; the latter relies on manufacturing support, supply chain depth, and large-scalereal-world scenarios.
In addition, vulnerabilities in cutting-edge U.S. hardwareare implied in the report: leading chips rely almost entirely on external manufacturing, and meaningful domestic production capacity in the U.S. willstill take time to materialize.
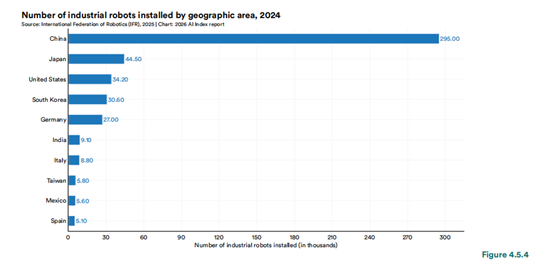
Newly installed industrial robots by countryin 2024 (in thousands)
Source: 2026AI Index Report
Global Impact and Strategic Implications
The differences outlined above indicate that while the performance of cutting-edge models in both countries has converged, the industrial structures, capital pathways, and talent foundations supportingthese models remain distinctly different. The United States is defined bymarket-driven capital concentration paired with a dense talent cluster around frontier labs; China, by industrial policy-led integration into manufacturingpaired with scaled deployment around application scenarios. Given their fundamentally distinct institutional bases, these two models are likely to continue diverging in the coming years.
A direct consequence of these structural differences will be their impact on third-party nations. Currently, the United States is extending itscomputing power networks to countries including the UAE, UK, and India throughprojects like OpenAI’s Stargate. NVIDIA’s “AI Factory” is establishing local technology stacks by partnering with national telecom operators. Faced with technological monopoly, as a member of the Global South, China has forged ahighly resilient “Southern Path” by embracing open-source ecosystems,strengthening infrastructure cooperation, and delivering localized applications. This path helps developing countries achieve technologicalimplementation, safeguard technological sovereignty, and bridge the digital divide. Meanwhile, the EU insists on exerting influence from the regulatory supply side through standards and rules (such as the “Brussels Effect” of GDPRand the AI Act).
For governance and strategic research, the traditional narrative of “catching up/leading” has lost its explanatory power. The focus of competition in the coming yearswill shift from mere “model parameter benchmarking” to the international adoptability of industrialmodels. This means the strategic focus should be anchored on:enhancing the global usability of open-source models, expanding thereplicability of manufacturing cooperation, and reducing localization costs forapplication solutions. Viewed in this light, the strategic value of Chineseopen-source frontier models such as DeepSeek and Qwen far exceeds theirrankings on test benchmarks. They are essentially key intermediaries and underlying pillars for China’s technological ecosystem and infrastructureintegration into the global network.
In-depth Analysis 3: The AI Sovereignty Framework—From ConceptualDiscourse to Quantitative Analysis Tools
The 2026 AI Index Report, for the first time, institutionalizes “AI Sovereignty” as a standalone analytical framework in Chapter 8. The reportdefines it as: “a state’scapacity to act deliberately and make independent decisions over thedevelopment, deployment, and governance of AI systems within its jurisdictionand, in some cases, beyond it through standards, trade, and regulation.”
This framework breaks down the general concept of “sovereignty” into five traceable dimensions: infrastructure, data, models,applications, and talent. This marks a shift in the focus of global AIgovernance discussions—from mere debates on ethical principles to the substantive measurement of national strategic autonomy. Empirical data fromthe report reveals extreme imbalance in the construction of global AI sovereignty.
1. Infrastructure Layer: China holds a significant lead, and this layerhas the most complete data.
2. Data Layer: Countries in the Global South exhibit a strong tendency toward “defensive sovereignty.”
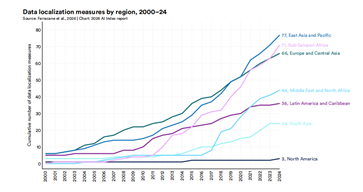
Trends in the cumulative number of data localization measures byregion, 2000–2024
Source: 2026AI Index Report
3. Model Layer: The U.S. has released a cumulative total of 1,618 models, while China has 849. For most developing countries (such as Latin America, which has only 2 models in this category), there remains a severe shortage at the model layer.
4. Talent Layer: The U.S. remains the primary destination for top talent, though its leading advantage is narrowing rapidly. India, meanwhile, has shifted from being a net exporter to a net importer of talent.
5. Application Layer: This is the weakest of the five dimensions in terms of data availability. It reflects that governments worldwide still lack transparent cross-borderstatistical standards for sovereignty-oriented AI procurement and public infrastructure deployment.
Beyond the data presentation, this framework reveals three governance challenges that warrant in-depth reflection:
First, the tension between transnational capitaland “sovereign infrastructure.”The report points out directly that despite governments’ emphasis on sovereignty, in practice, “the line between public and private is becoming blurred. ”NVIDIA’s “AI Factory” and OpenAI’s Stargate project are deeply integrating into the national infrastructure of other countries through partnerships withnational telecom operators. This raises a core question: when sovereign computing power is dominated and operated by transnational private capital,what is the core of “sovereignty”—asset ownership, data control, or the ability to audit and cut off access at critical moments?
Second, inherent contradictions among the dimensions.The data show that sovereign dimensions are not positively correlated. For example, sub-Saharan Africa has high-intensity datalocalization measures, yet it produces almost no local models. This suggests that for countries without a complete industrial stack, a strong sovereignty policy in a single dimension (such as data restrictions) might instead undermine the development of its model capabilities. Sovereignty building requires systematic balance, rather than overemphasis on isolated dimensions.
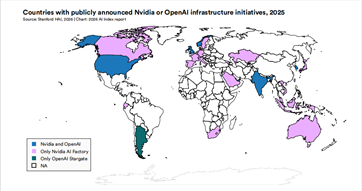
Countries with publicly announced NVIDIA or OpenAI infrastructureinitiatives, 2025
Source: 2026AI Index Report
Third, the limitations of the measurement tools themselves. Existing indicators tend to capture quantitative differences (such asthe number of supercomputing centers or policy items) rather than qualitativedepth. Having dozens of data policies does not necessarily equate tohaving substantial data governance effectiveness. How to measure theoperational “depth” and “resilience” of sovereignty is an area that future governance research needs to address.
For global AI governance, this five-layer framework provides an open coordinate system. China’s specific practices—including its data exportsecurity assessment mechanism, generative AI management measures, national computing power coordination mechanism, and the international diffusion ofopen-source large models—can now be systematically described and studied within a comparable international framework, rather than being scattered across separate discourses of governance, industry, and diplomacy as before.
As a member of the Global South, China’s practices in infrastructure integration and open-source ecosystems have precisely filledgaps in the application and model layers for developing countries within this framework. Through this coordinate system, we can see more clearly how the Chinese path helps broad developing countries achieve substantial improvementsin technological sovereignty through infrastructure partnerships, without relying on extreme capital advantages.
This may be the report’s most important conceptual contribution this year: it does not define sovereignty, but provides a tool that allows AI practices across different jurisdictions worldwide to engage in rational dialogue on a common comparative basis.
04 Conclusion
This analysis systematically reviews the deep trendsrevealed in the 2026 AI Index Report, outlining a complete picture of global artificial intelligence shifting from a “one-dimensional technological race” to “multi-dimensional structural competition.”
The future of global AI development has evolved from simple technological catch-up to an all-around contest of governance models, industrial ecosystems, and the depth of national sovereignty.
Authors
Yao Xu, Secretary-General of CGAIG and Associate Professor at FDDI
Zhong Yifei, Research Assistant of CGAIG
Yu Yue, Research Assistant of CGAIG
Yuan Luming, Research Assistant of CGAIG
Original URL: https://mp.weixin.qq.com/s/klpNF4PVWCsoaJXerKhheg